Login
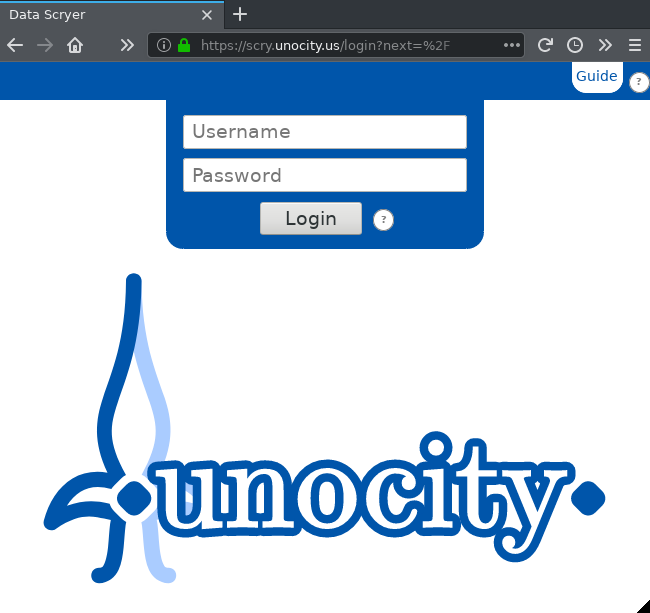
You've probably passed by the login screen to get to this guide, but if not, this is what you would see the first time you navigate to https://scry.unocity.us.
Feel free to examine the Guide to see an example analysis with step-by-step instructions.
Login using your username (email address) and password.
A trial demonstration username is demo@unocity.us with password demo. Feel free to try it out, and make sure to read the guide for a tour.
This guide shows how to use Data Scryer to perform an analysis of data such as a large power system's bus voltage data.
There are many features and many ways of extracting information from a data set, so experimentation and iterative analysis are essential.
In this guide, consider a data set that contains three columns. The first column contains bus voltage magnitudes measured in p.u. The second contains bus voltage angles measured in degrees between -90 and 90. And the third contains bus nominal voltages in the neighborhood of 115kV to 765kV.
You've probably passed by the login screen to get to this guide, but if not, this is what you would see the first time you navigate to https://scry.unocity.us.
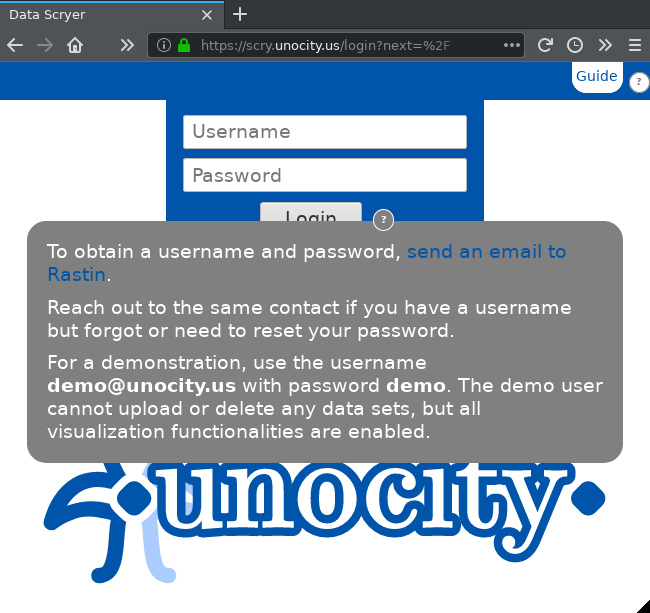
There are help icons everywhere. Click on them to activate and deactivate.
The one next to the login button tells you how to get a username and password if you do not already have one.
It also tells you how to login using a demo user. The remainder of this guide will use tools and a data set that you can use in the demo.
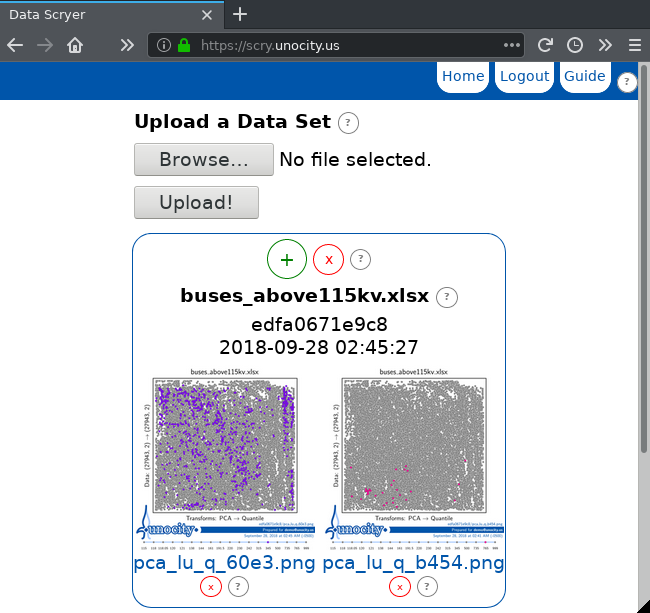
When you login as the demo user, you will see four distinct areas from top to bottom: 1) the navigation bar at the top. 2) a place where data sets can be uploaded. 3) a few buttons above a data set titled buses_above115kv.xlsx. 4) Unocity's logo and the build date of the software.
Since the demo user is open to all users, there may be some visualizations in the center along with the data set name. The demo user cannot upload new data sets nor delete the existing one, but the demo allows you to create and delete individual visualizations.
As always, the help buttons may be activated for details on how to use everything.
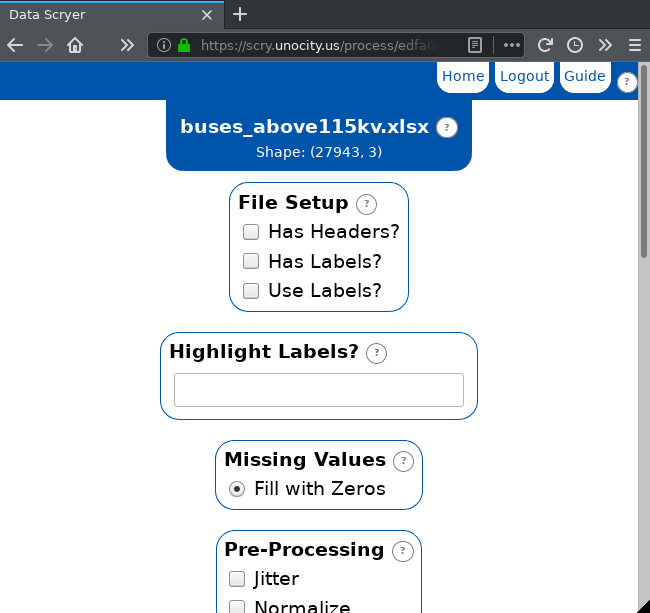
Pressing on the green + icon just above a data set's name will take you to the visualization creation page. Here you will find many options as well as some information about the current data set.
At the top of the screen, the data set's name and shape are display. This data set has 27943 rows and three columns. We know the columns are bus magnitude, bus angle, and nominal voltage.
In general, you will know about your own data sets that you upload.
If there are any missing values or non-numeric values (NaNs, or not-a-numbers) in your data set, their counts and the columns that contain them will be listed below the data set's shape.
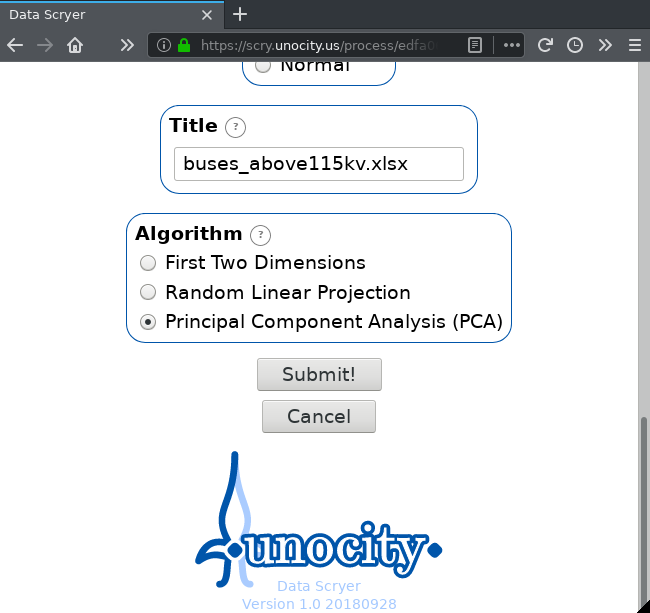
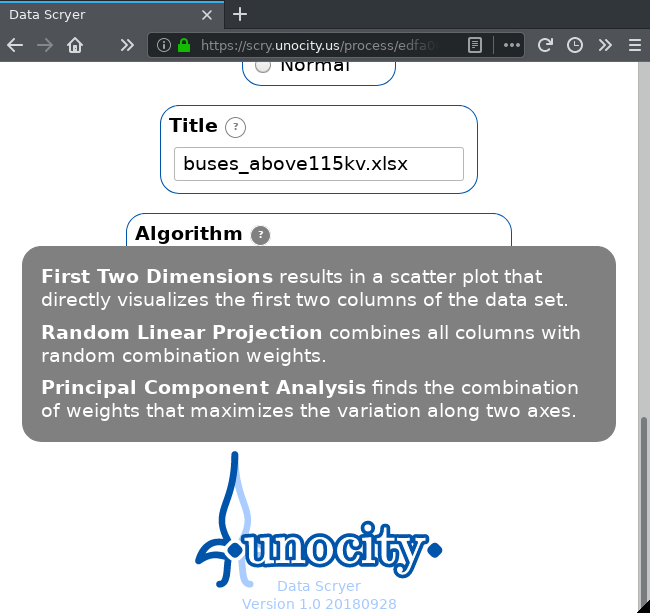
For now, leave all settings as default, scroll to the bottom, and choose Principal Component Analysis (PCA) as the algorithm.
Then, hit Submit!
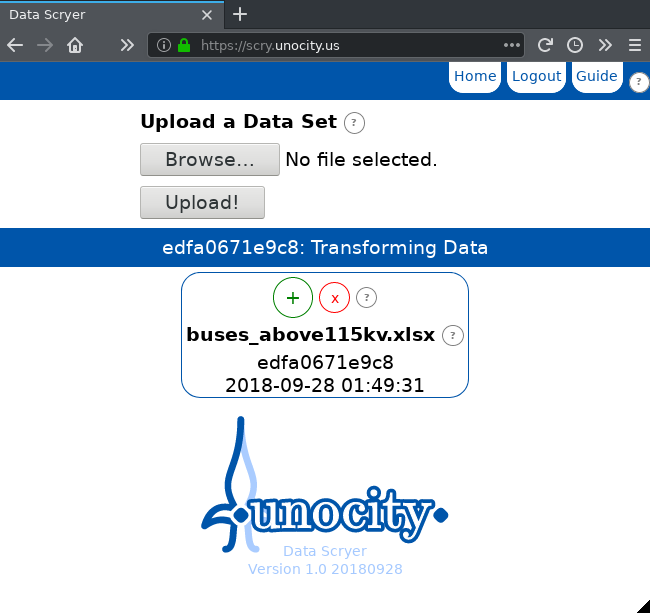
As soon as you hit Submit, you will be returned to the Home screen. However, there is an additional flash of information that describes what stage of processing the visualization is in.
Once the processing is complete, the page will reload and a new thumbnail will appear.
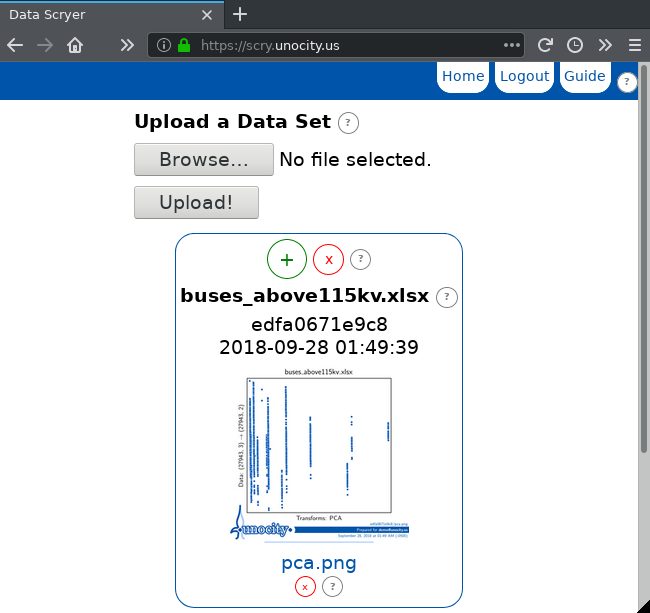
The visualization that we created is titled pca.png.
Notice that there are several thin, vertical clusters of data. These data clusters correspond to bus nominal voltages.
In reality, the nominal voltages are class labels and not numeric data, so we must instruct the visualization to treat the third column as labels.
Create a second visualization by clicking on the green + sign, enabling Has Labels and Use Labels, and selecting again PCA as the algorithm.
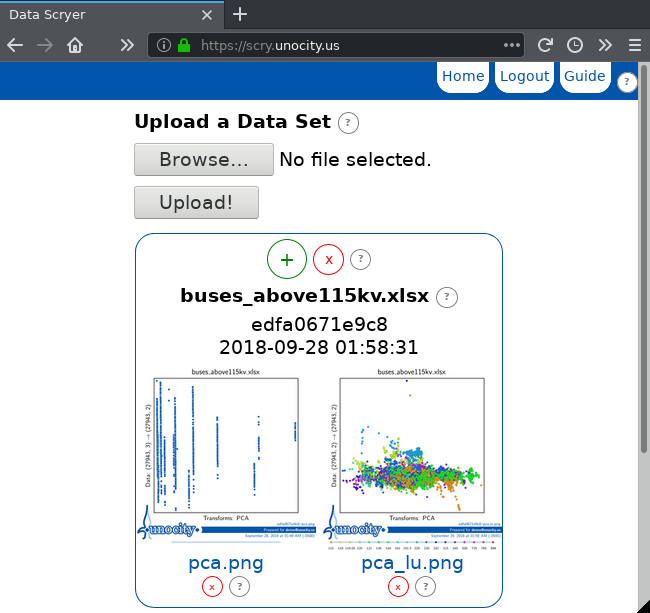
The resulting visualization is called pca_lu.png
In this visualization, we see a mess of colors, but almost all points are grouped together in a center cluster. With knowledge of the data set, we know that this cluster is anchored around 1 p.u. and spreads between -90 and 90 degrees.
From this view, the few outliers that have very high or low bus voltages are clearly visible. These buses would need further examination by a power system planner.
Delete the previous two visualizations using the small red xs below the filenames pca.png and pca_lu.png.
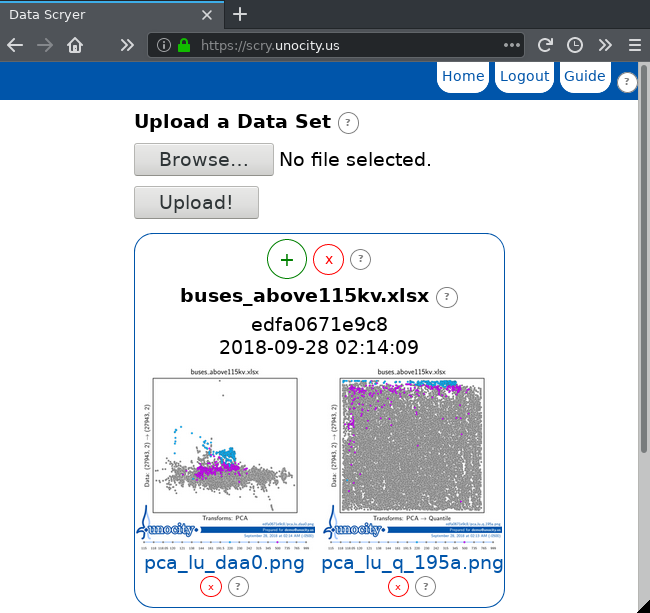
Create a new visualization. Enable Has Labels, Use Labels, and PCA. Type in 220,500 for Highlight Labels in order to highlight only the buses that are 220kV or 500kV as labeled in the data set. Submitting this visualization will result in pca_lu_daa0.png.
Create another visualization using the same settings, but this time also enable Quantile in the Post-Processing section. This will be saved as pca_lu_q_195a.png.
The Quantile transformation ignores the outliers and spreads the main cluster across the entire space.
Notice that the 500kV buses are near the top of the cluster, meaning that they have high per-unit voltages (as expected because 500kV buses typically are used to transmit large amounts of power). Notice also that the 220kV buses are at even higher voltages. This is curious and needs further examination by a power system planner.
Delete the visualizations pca_lu_daa0.png and pca_lu_q_195a.png.
Create two new visualizations with Has Labels and Use Labels enabled, Quantile for Post-Processing, and PCA for the algorithm. In one visualization, highlight the 345kV buses by typing 345 in the Highlight Labels box to get pca_lu_q_60e3.png.
In the other visualization, highlight the 765kV buses by typing 765 into the Highlight Labels box to get pca_lu_q_b454.png.
Notice that the 345kV buses are spread across the entire range but that there is a cluster grouped along the right edge. Did you know that your geographic region has a large but separated island?
Why is it that all of the 765kV buses have below average per-unit magnitudes? This is concerning and needs to be examined further by a power system planner.
In a matter of moments, we generated several visualizations of a data set with over 27 thousand rows. Different visualizations allowed us to clearly identify several patterns in our data. Increasing data sizes and dimensions become significantly more difficult to analyze, but the tools here will allow you to quickly get a feel for the data.
Remember to examine all of the help icons for detailed information. Data analysis and machine learning are arts and require expertise. But if you are familiar with your data, the tools here will allow you to gain an even deeper understanding.
If you followed along with this guide by logging in as the demo user, please delete all of your visualizations to leave the demo area clear for others.
Feel free to contact us if you like this software or want some support analyzing your own data. Also, there are more algorithms on the way, so definitely let us know if there are any you would like to see.
Thanks!
Rastin Rastgoufard, Ph.D.
